In this section, the mean, standard deviation, minimum, and maximum
values of interpolated rainfall and precipitation estimated from Meteosat
for each year of 95, 96 and 97 were investigated. The table1 shows the
results.
|
|
|
|
|||||
|
|
|
|
|
|
|
||
| Steppes
(mm) |
|
|
|
|
|
|
|
|
|
|
|
|
|
|
|
|
|
|
|
|
|
|
|
|
|
|
|
|
|
|
|
|
|
|
| Agri.
(mm) |
|
|
|
|
|
|
|
|
|
|
|
|
|
|
|
|
|
|
|
|
|
|
|
|
|
|
|
|
|
|
|
|
|
|
| Savanna
(mm) |
|
|
|
|
|
|
|
|
|
|
|
|
|
|
|
|
|
|
|
|
|
|
|
|
|
|
|
|
|
|
|
|
|
|
| Woodland
(mm) |
|
|
|
|
|
|
|
|
|
|
|
|
|
|
|
|
|
|
|
|
|
|
|
|
|
|
|
|
|
|
|
|
|
|
| Senegal
(mm) |
|
|
|
|
|
|
|
|
|
|
|
|
|
|
|
|
|
|
|
|
|
|
|
|
|
|
|
|
|
|
|
|
|
|
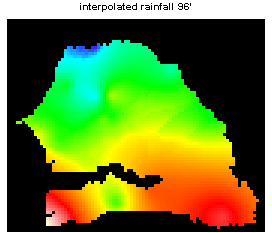
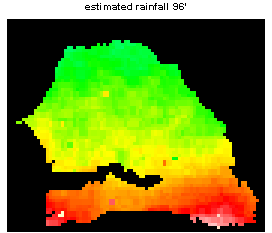
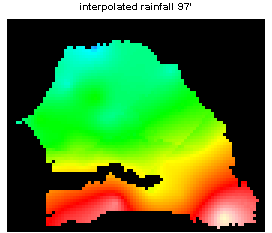
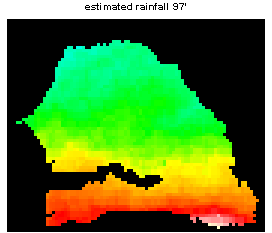
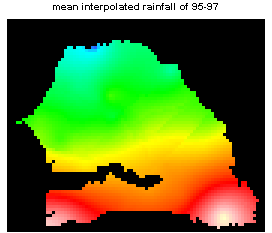
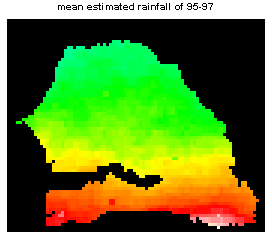
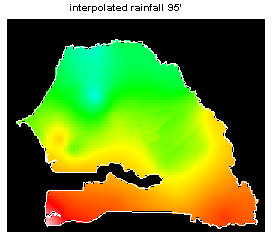
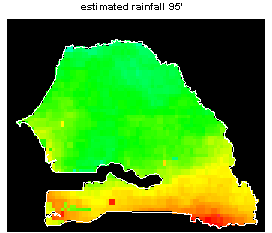
The mean value, maximum value and standard deviation show a decrease
comparing interpolated rainfall to estimated rainfall. Interpolated rainfall
and estimated rainfall presented high correlation. The correlation coefficients
are 0.82, 0.9, and 0.93 for 95, 96 and 97 respectfully. The relationship
of seasonal integrated NDVI with interpolated rainfall and estimated rainfall
was also examined. The table shows the result.
|
|
|
|
|||
|
|
|
|
|
|
|
|
|
|
|
|
|
|
Following table shows each subgroup's correlation coefficients of mean
NDVI and mean rainfall of 95-97.
|
|
|
|
|
|
|
|
|
|
|
|
|
|
|
|
|
|